Observability and traces for AI applications & agents.
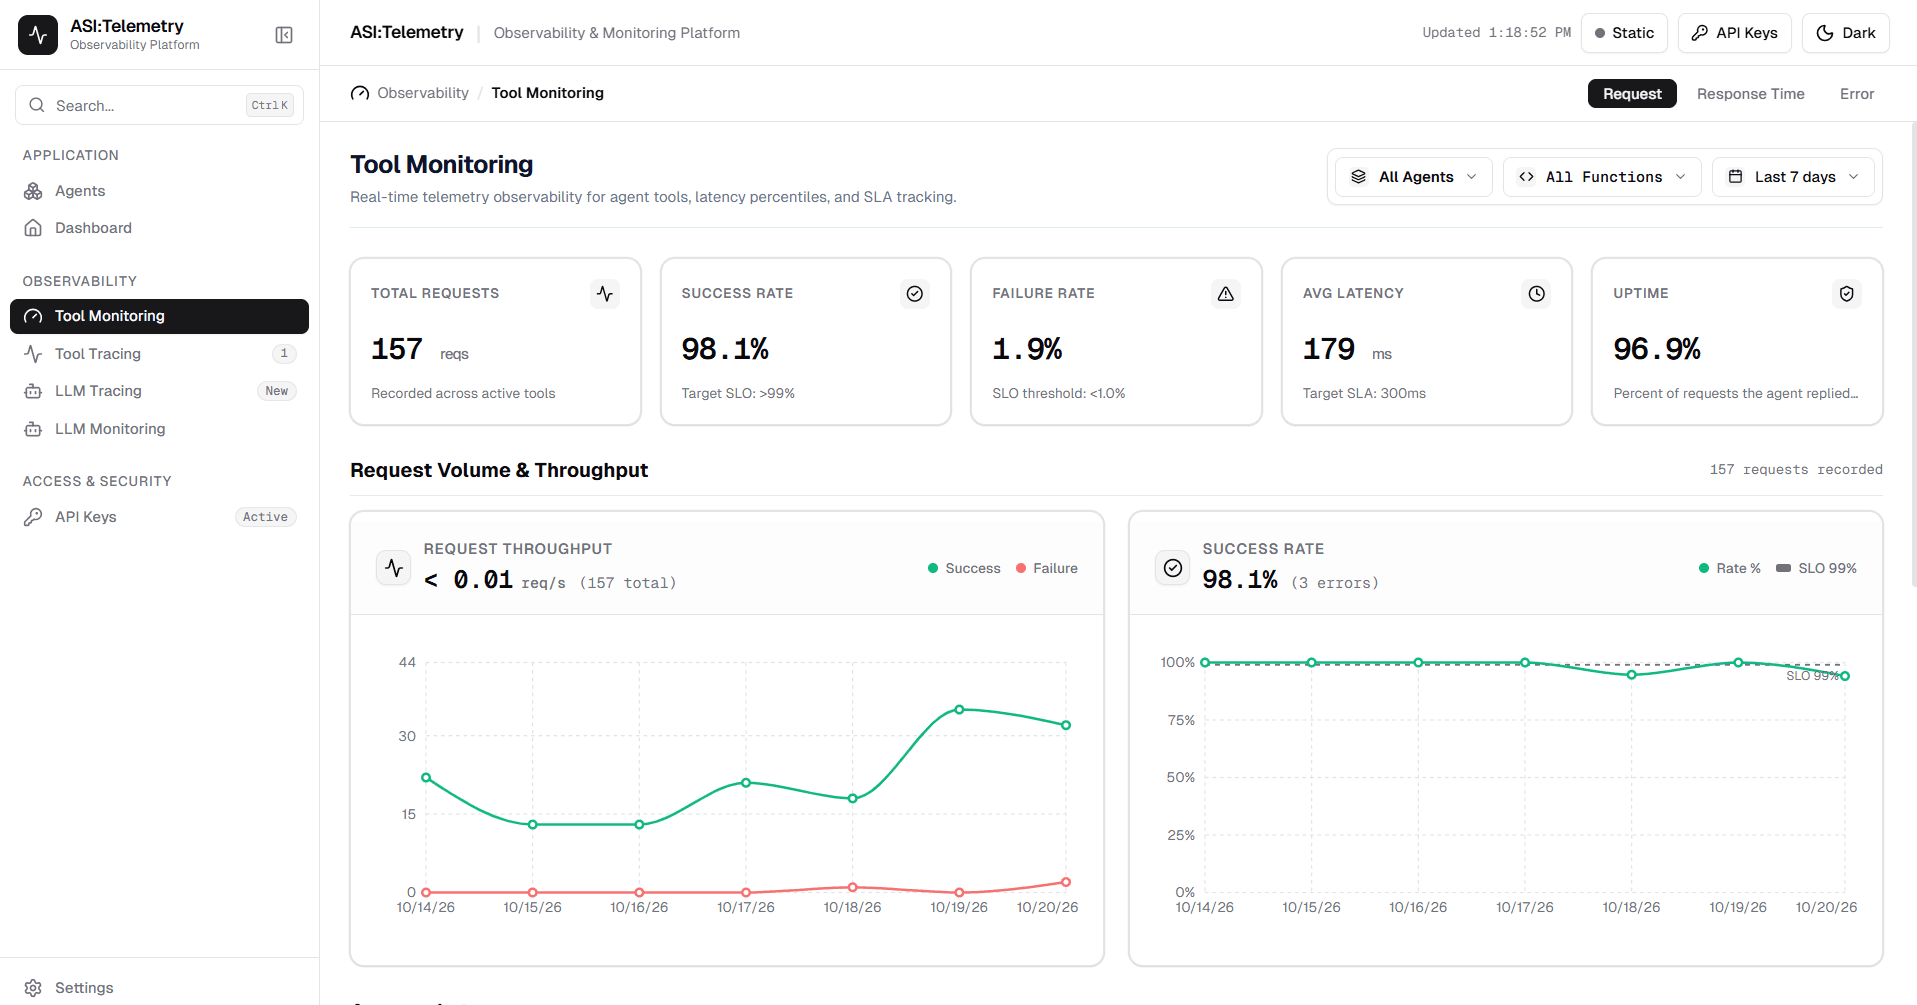
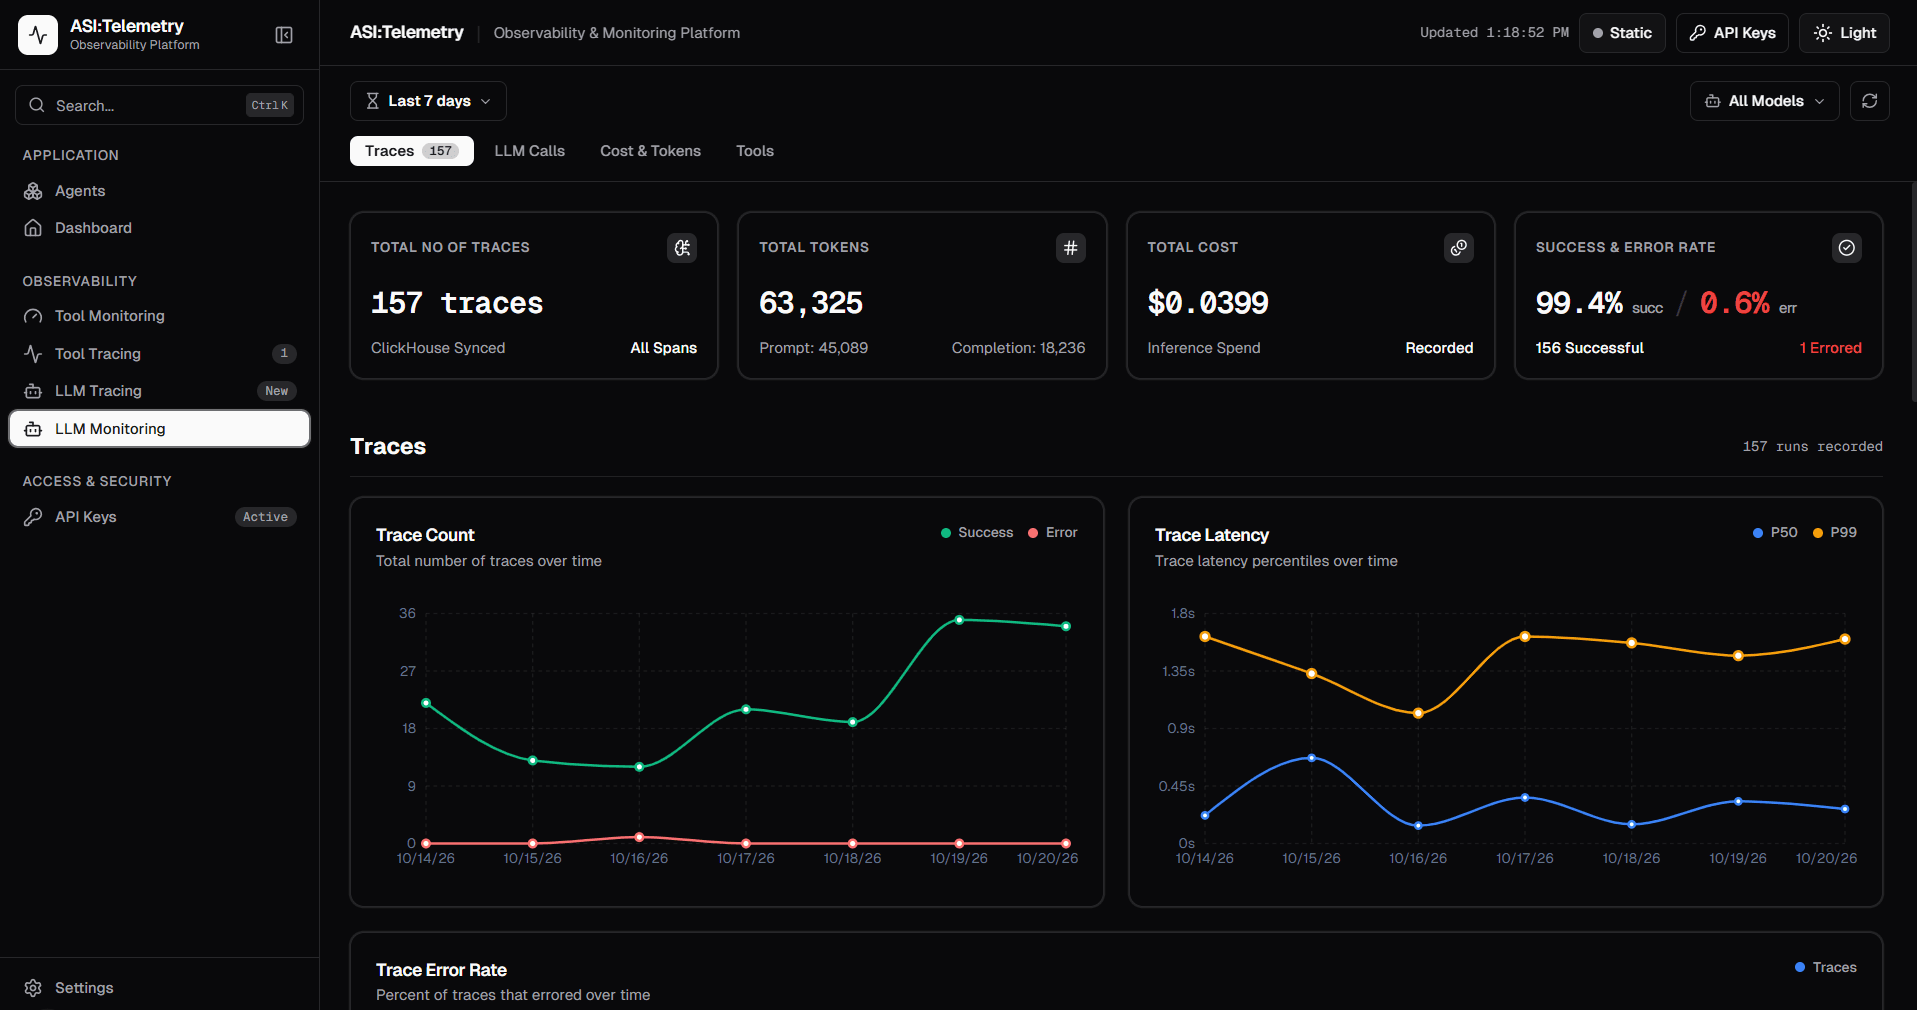
Understand what your agents are doing in production. Trace step-by-step reasoning, monitor latency percentiles, and track token spend—backed by ClickHouse for real-time scale.
Instrument in three lines of Python
No complicated middleware or proxy servers. Decorate any agent function, prompt chain, or tool with zero performance penalty.
# 1. Install & import the tracerimport asi_telemetry# 2. Initialize with your project API keyasi_telemetry.init(api_key="asi_live_7a9f8b2c4e1d3f0a")# 3. Decorate your agent reasoning or tool call@asi_telemetry.traceable(name="research_agent", run_type="agent")def run_agent(query: str):# Automatic capture: prompt, tokens, latency, tool calls & errorsresponse = call_llm(query)return response
Built specifically for LLM & agent workloads
Traditional application performance monitoring breaks down on recursive agent loops, tool invocations, and token-based pricing models.
Hierarchical Trace Trees
Connect parent agent decision chains to child tool calls, prompt expansions, and sub-agent delegates. Retain full context and causality across the entire lifecycle.
Latency Percentiles (p50 / p95 / p99)
Stop relying on misleading average times. Directly query high-percentile latency distributions to pinpoint slow tools, unresponsive APIs, or model generation stalls.
Token & Cost Accounting
Automatic calculation of prompt tokens, completion tokens, and real dollar costs for Gemini, OpenAI, Claude, and custom local models.
ClickHouse Columnar Storage
Fast queries over tens of millions of records. Partitioned by account and project so your queries stay responsive regardless of ingestion volume.
Start observing your agent workflows today.
Sign up in seconds, generate your project API key, and begin monitoring traces and tokens.